Load Simulator
The load simulator generates baseload curves for households independently from the simulation. In this way, computational cost for the actual simulation is reduced and households replay the generated load curves.
The following devices are included:
| Device | Saturation Level (%) | Activation Rate (per day) | Consumption Share (%) |
|---|---|---|---|
| cooking | 94.0 | 1.66 | 13.5 |
| dishwasher | 67.3 | 0.56 | 3.8 |
| drier | 39.1 | 0.26 | 5.9 |
| entertainment | 94.2 | 1.60 | 14.9 |
| freezer | 50.5 | variable | 5.5 |
| fridge | 99.7 | variable | 15.9 |
| lighting | 100.0 | 1.84 | 12.4 |
| office | 85.2 | 1.25 | 16.6 |
| other | 100.0 | 2.00 | 8.7 |
| washing machine | 94.5 | 0.32 | 2.8 |
Devices are simulated using (multiple) Gaussian distributions, which are weighed with a factor F. To reach high precision the previous and following day are considered. For example, a stove consists of three Gaussian distributions F=0.15, μ=07:30, σ=01:30, F=0.55, μ=12:00, σ=01:30 and F=0.15, μ=17:30, σ=02:00.
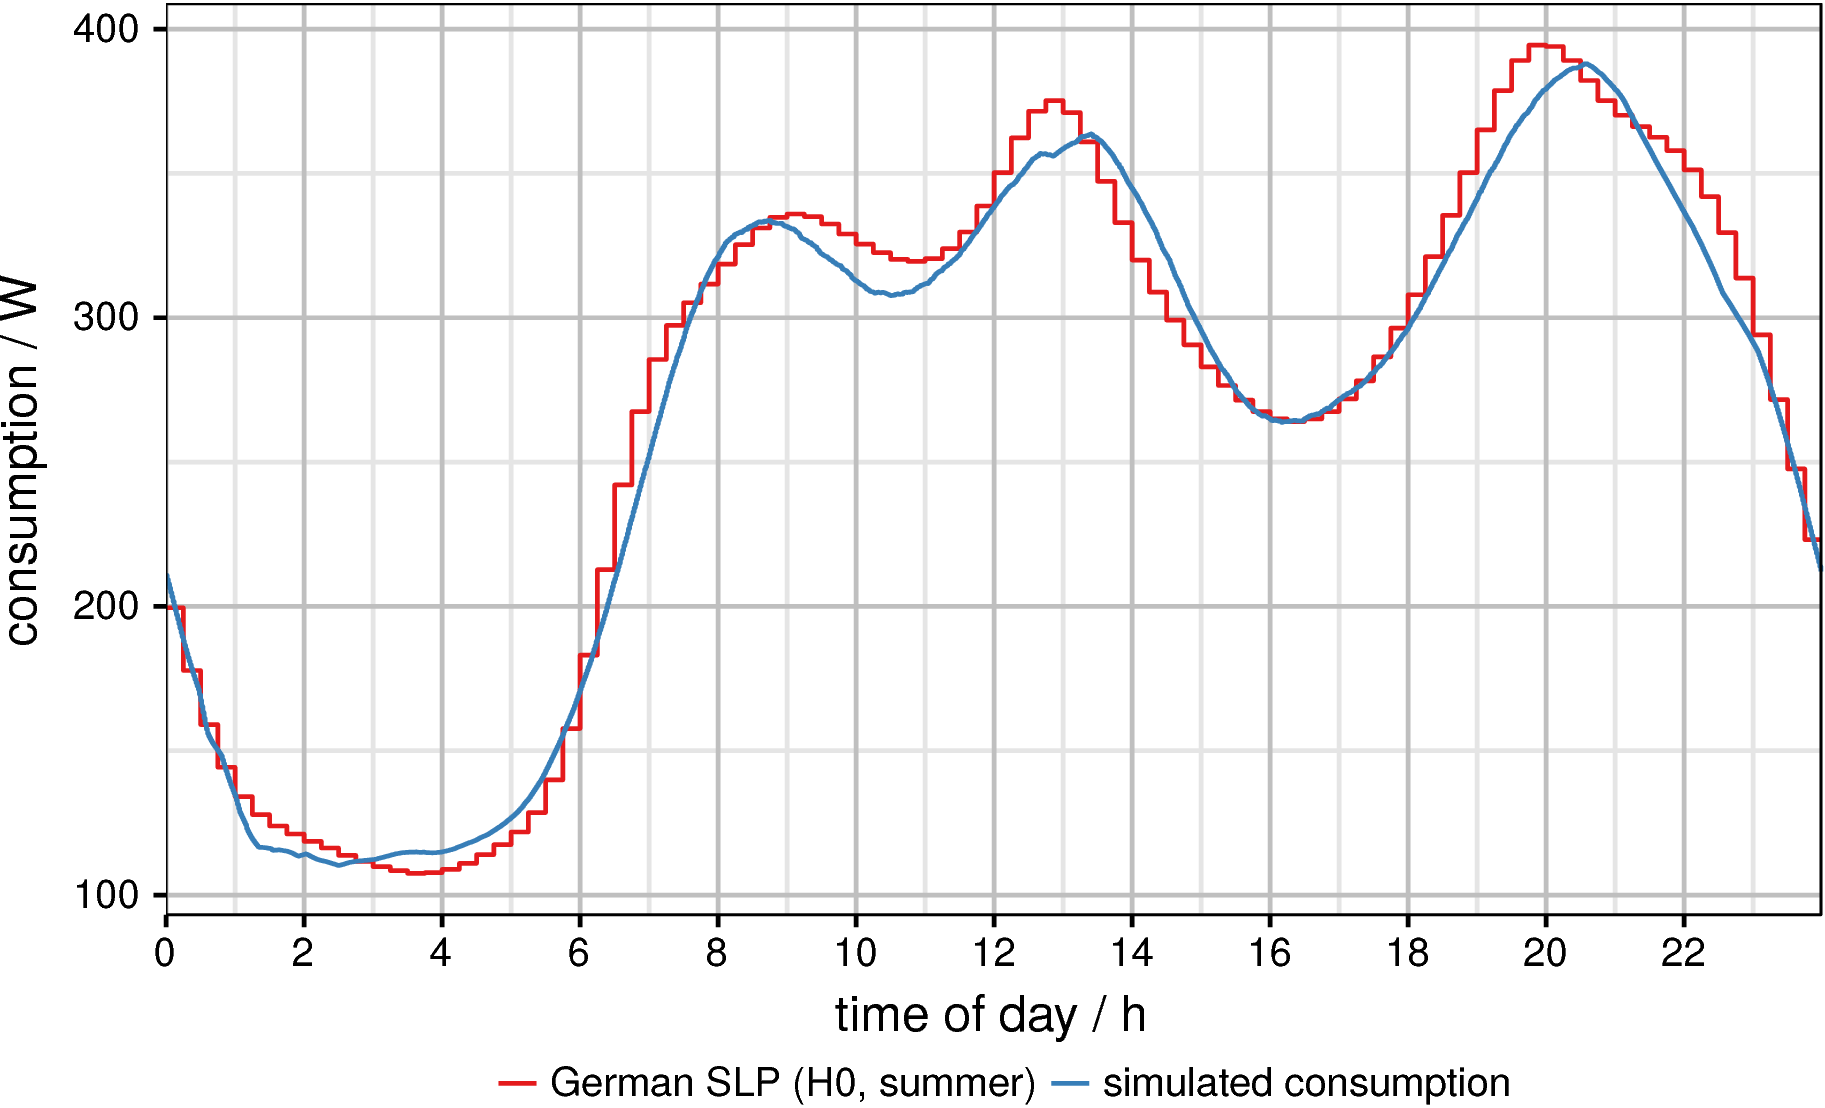
Combined with a many repetitions and a random-number-generator, the load simulator provides many load profiles for households. 1000000 repetitions result in: