Architecture and Workflow
The architecture of SiENA is based on
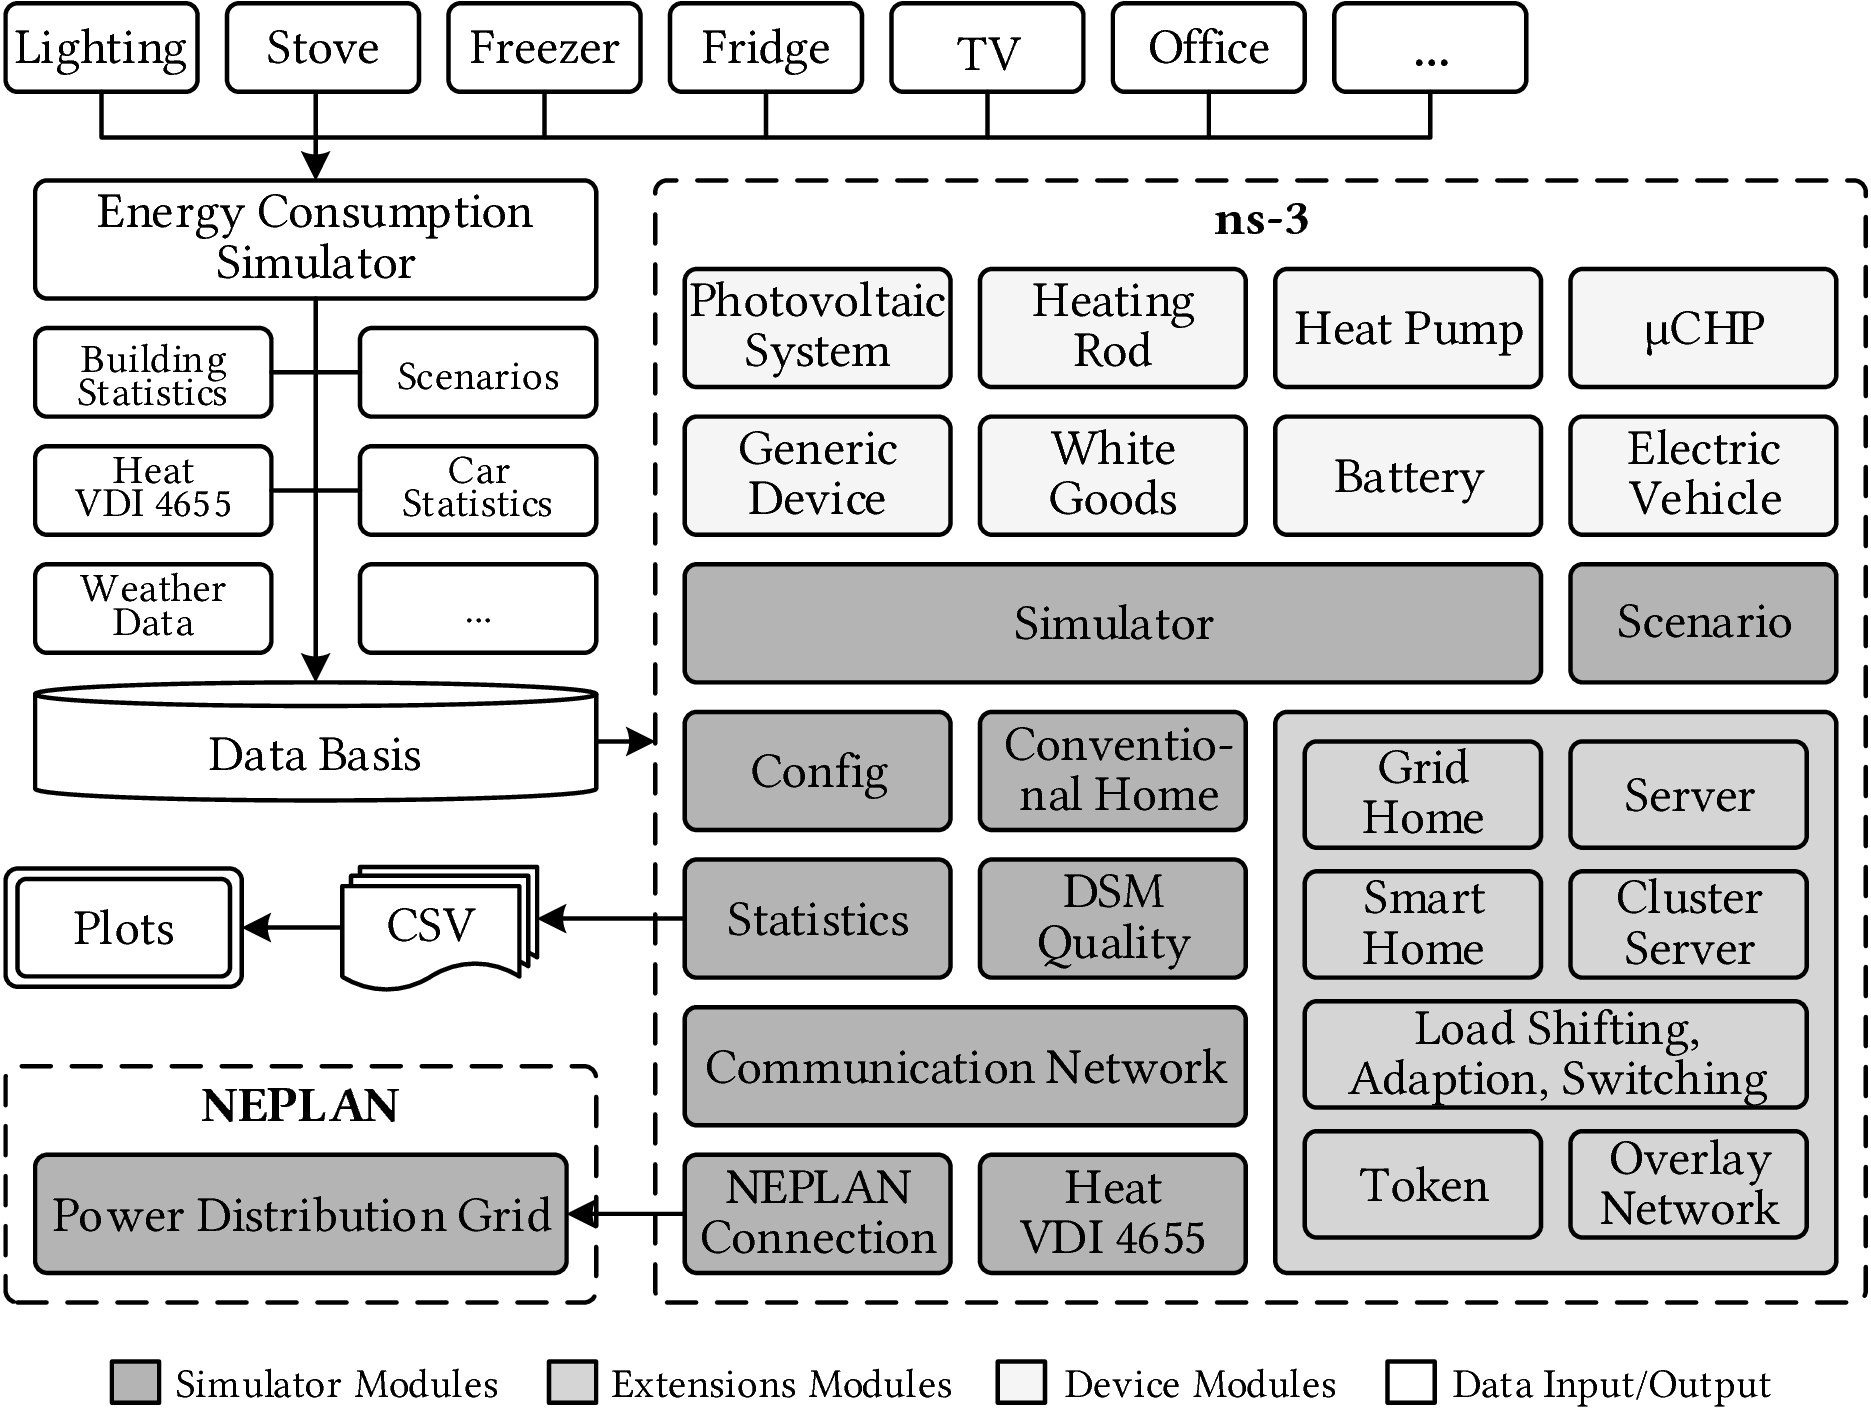
- Data Input and Output
A standalone load simulator generates baseload curves for household based on real measured devices. A data basis provides statistical data and device configurations for all simulated devices. - Device Modules
Simulation Models for participating devices. - Extension Modules
These modules implement the behaviour of households, servers and energy management algorithms. They can be loaded semi-dynamically by dropping the according config file, e.g. algo_privade.json, in the config folder. SiENA makes sure that the households dynamically load the according behaviour. These modules can be extended easily. - Simulator Modules
The interface to ns-3 for essential functionality, e.g. scheduling events, running the power and communication networks, statistics, etc.
Workflow
This is the typical workflow of SiENA:
- Data Basis Import
For example, energy consumption data for all suitable devices, different device configurations (e.g. parameters of EVs), statistical data for some devices (e.g. departure times for EVs and the corresponding trip lengths), as well as scenario definitions. - Scenario Generation
The simulator reads configuration and scenario files or generates a randomised scenario. A scenario and configuration consists of, for example, different amounts of households, a communication network and a DEM algorithm. - Initialisation
All households, devices, and participants are initialised based on the data-basis. The behaviour of them, as well as DSM algorithms, are implemented in modules, which are loaded dynamically and can be changed easily in the configuration. - Simulation
During the simulation the event-based scheduling of ns-3 is used for execution. Modules create discrete events, depending on available data in data-basis. The step-size of the discrete events can be adjusted freely. All communication technology capabilities of ns-3 can be used, for example basic protocols like TCP or systems like Wi-Fi or LTE.
Simulation Step:- Households check their devices
- Households communicate according to the DEM algorithm via a communication networks
- A power flow analysis is run optionally
- Statistics
During a simulation statistics are gathered and exported at the end. The quality of DSM is analysed and plots are generated with R.